
[Solved]Question 21 Illustration 8 Letter Shows Clipping Limits Adc Input D B C 25 Points Question Q37037680
QUESTION 21
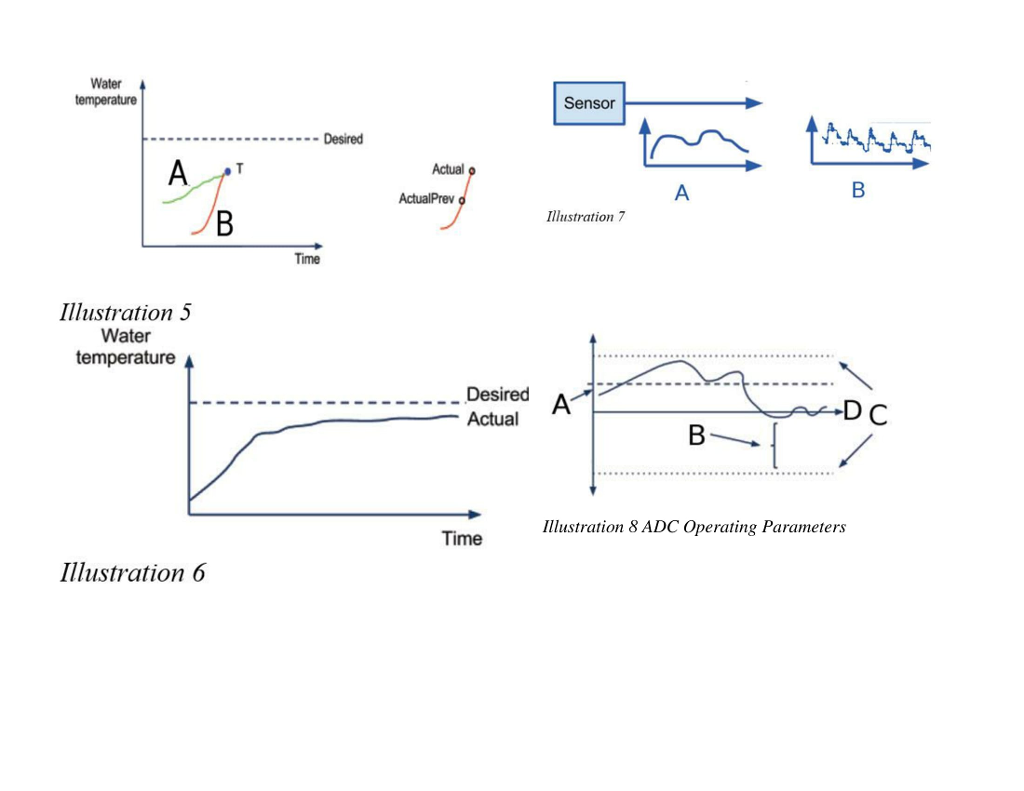
In Illustration 8 what letter shows the clipping limits of theADC input?
D
A
B
C
2.5 points
QUESTION 22
In Illustration 8 what letter illustrates the underloadedportion of the ADC?
B
A
C
D
2.5 points
QUESTION 23
In Illustration 8 what letter shows the actual signalbaseline?
B
A
D
C
2.5 points
QUESTION 24
In Illustration 8 what letter shows the actual baseline of theADC input?
D
C
B
A
2.5 points
QUESTION 25
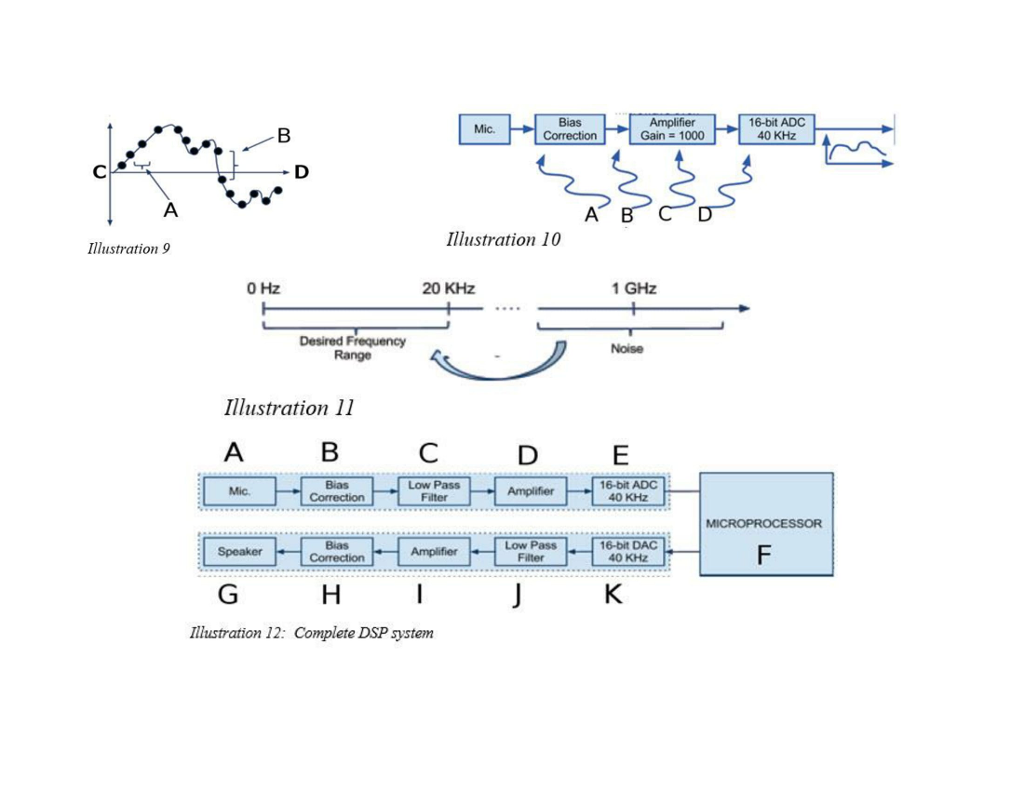
In Illustration 9, which label accurately reflects thespecification associated with sampling rate?
C
B
A
D
2.5 points
QUESTION 26
In Illustration 9, which label accurately reflects thespecification which defines just how precise does the analog todigital conversion needs to be?
A
B
C
D
2.5 points
QUESTION 27
In Illustration 10, if an embedded system is operated near atransmitter (cell phone. or microwave oven or other device thatemits Radio Frequency Interference (RFI., which part of theembedded system is affected?
ABCD
A
D
AB
2.5 points
QUESTION 28
Illustration 11 illustrates the effect of noise from a microwaveoven (in the GHz range., whcih can produce an unwanted signal inthe audible range. An audio recording, for instance, would producean ugly sound that is directly from the microwave own, even thoughthe microwave oven is not generating any sounds. This occursbecause of what sampling property?
Aliasing
Heterodyning
Side-Band effects
Beat frequencies
2.5 points
QUESTION 29
In Illustration 12 which section produces a low amplitude signalwith noise included?
E
A
G
C
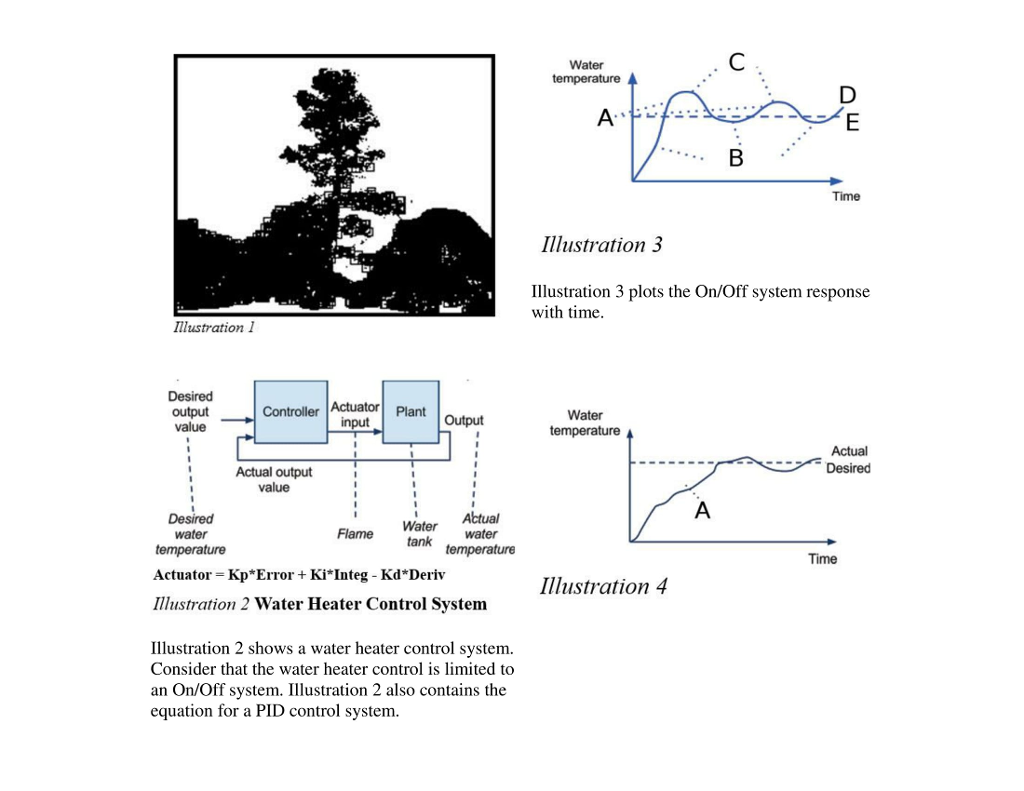
Water Time Illustration 3 Illustration 3 plots the On/Off system response with time Illustration 1 Plant Output Controller Actuator output Water Actual Actual output value Desired Water water Flame tank temperature water temperature Actuator- Kp Error + Ki Integ – Kd Deriv Illustration 2 Water Heater Control System Time Illustration 4 Illustration 2 shows a water heater control system. Consider that the water heater control is limited to an On/Off system. Illustration 2 also contains the equation for a PID control system Water temperature Sensor -Desired Actual Illustration 7 Time Illustration 5 Water temperature Desired A Actual Illustration 8 ADC Operating Parameters Time Illustration 6 16-bit ADC 40 KHz Gain 1 000 Illustration 10 Illustration 9 0 Hz 20 KHz 1 GHz Desired Frequency Illustration 11 16-bit ADC 40 KHz Low Pass Filter Low Pasts Filter 16-bit DAC 40 KHz Illustration 12: Complete DSP system Show transcribed image text Water Time Illustration 3 Illustration 3 plots the On/Off system response with time Illustration 1 Plant Output Controller Actuator output Water Actual Actual output value Desired Water water Flame tank temperature water temperature Actuator- Kp Error + Ki Integ – Kd Deriv Illustration 2 Water Heater Control System Time Illustration 4 Illustration 2 shows a water heater control system. Consider that the water heater control is limited to an On/Off system. Illustration 2 also contains the equation for a PID control system
Water temperature Sensor -Desired Actual Illustration 7 Time Illustration 5 Water temperature Desired A Actual Illustration 8 ADC Operating Parameters Time Illustration 6
16-bit ADC 40 KHz Gain 1 000 Illustration 10 Illustration 9 0 Hz 20 KHz 1 GHz Desired Frequency Illustration 11 16-bit ADC 40 KHz Low Pass Filter Low Pasts Filter 16-bit DAC 40 KHz Illustration 12: Complete DSP system
Expert Answer
Answer to QUESTION 21 In Illustration 8 what letter shows the clipping limits of the ADC input? D A B C 2.5 points QUESTION 22 In … . . .
OR
