
[Solved]Engr 102 Lab 12 Activity 1 Plotting Curves Derivatives Done Team Team Develop Program Ask Q37173942
Using Python plz!
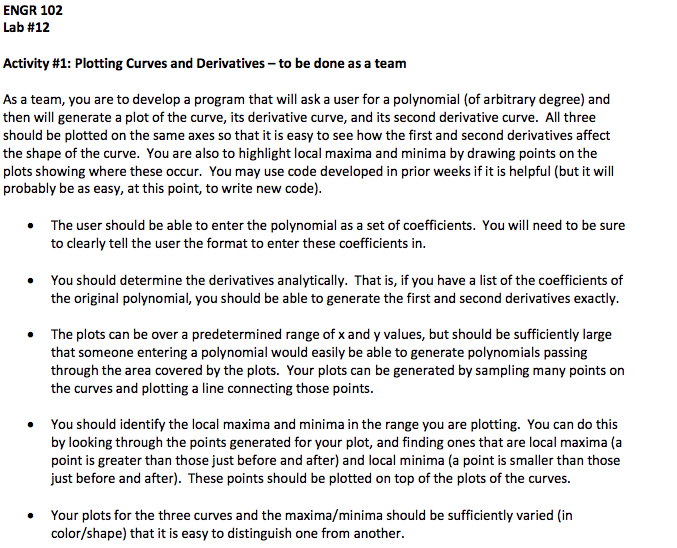
ENGR 102 Lab #12 Activity #1: Plotting Curves and Derivatives-to be done as a team As a team, you are to develop a program that will ask a user for a polynomial (of arbitrary degree) and then will generate a plot of the curve, its derivative curve, and its second derivative curve. All three should be plotted on the same axes so that it is easy to see how the first and second derivatives affect the shape of the curve. You are also to highlight local maxima and minima by drawing points on the plots showing where these occur. You may use code developed in prior weeks if it is helpful (but it will probably be as easy, at this point, to write new code) The user should be able to enter the polynomial as a set of coefficients. You will need to be sure to clearly tell the user the format to enter these coefficients in You should determine the derivatives analytically. That is, if you have a list of the coefficients of the original polynomial, you should be able to generate the first and second derivatives exactly. . The plots can be over a predetermined range of x and y values, but should be sufficiently large that someone entering a polynomial would easily be able to generate polynomials passing through the area covered by the plots. Your plots can be generated by sampling many points on the curves and plotting a line connecting those points. You should identify the local maxima and minima in the range you are plotting. You can do this by looking through the points generated for your plot, and finding ones that are local maxima (a point is greater than those just before and after) and local minima (a point is smaller than those just before and after). These points should be plotted on top of the plots of the curves. . Your plots for the three curves and the maxima/minima should be sufficiently varied (in color/shape) that it is easy to distinguish one from another Follow the following process: Complete parts a and b before writing any code! a) First, you will practice generating a bottom-up design As a team, brainstorm what functionality you are likely to need in this program. For each basic task your team comes up with, where all the pieces needed are already known, write down a short function description, along with any input arguments needed, and what return value there will be, if any (i.e. construct a document, which will also be used for the subsequent design descriptions) a. b. Only do this for basic functions for which the steps you will need to follow are well known or obvious. You can consider functions that will call other functions, as long as you have first designed the other function. Your goal in this part is not to generate a complete code design, but rather to identify functions to implement that are likely to be helpful in your program c. b) Next, create a top-down design of the program Put together a document (can be added to the one from part (a)) outlining the top- down design that your team comes up with. You should make use of the functions created in the bottom-up “phase”, above, to whatever extent seems helpful a. b. We were unable to transcribe this imageShow transcribed image text ENGR 102 Lab #12 Activity #1: Plotting Curves and Derivatives-to be done as a team As a team, you are to develop a program that will ask a user for a polynomial (of arbitrary degree) and then will generate a plot of the curve, its derivative curve, and its second derivative curve. All three should be plotted on the same axes so that it is easy to see how the first and second derivatives affect the shape of the curve. You are also to highlight local maxima and minima by drawing points on the plots showing where these occur. You may use code developed in prior weeks if it is helpful (but it will probably be as easy, at this point, to write new code) The user should be able to enter the polynomial as a set of coefficients. You will need to be sure to clearly tell the user the format to enter these coefficients in You should determine the derivatives analytically. That is, if you have a list of the coefficients of the original polynomial, you should be able to generate the first and second derivatives exactly. . The plots can be over a predetermined range of x and y values, but should be sufficiently large that someone entering a polynomial would easily be able to generate polynomials passing through the area covered by the plots. Your plots can be generated by sampling many points on the curves and plotting a line connecting those points. You should identify the local maxima and minima in the range you are plotting. You can do this by looking through the points generated for your plot, and finding ones that are local maxima (a point is greater than those just before and after) and local minima (a point is smaller than those just before and after). These points should be plotted on top of the plots of the curves. . Your plots for the three curves and the maxima/minima should be sufficiently varied (in color/shape) that it is easy to distinguish one from another
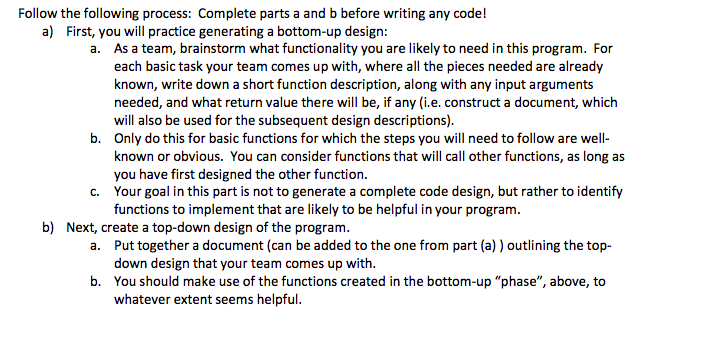
Follow the following process: Complete parts a and b before writing any code! a) First, you will practice generating a bottom-up design As a team, brainstorm what functionality you are likely to need in this program. For each basic task your team comes up with, where all the pieces needed are already known, write down a short function description, along with any input arguments needed, and what return value there will be, if any (i.e. construct a document, which will also be used for the subsequent design descriptions) a. b. Only do this for basic functions for which the steps you will need to follow are well known or obvious. You can consider functions that will call other functions, as long as you have first designed the other function. Your goal in this part is not to generate a complete code design, but rather to identify functions to implement that are likely to be helpful in your program c. b) Next, create a top-down design of the program Put together a document (can be added to the one from part (a)) outlining the top- down design that your team comes up with. You should make use of the functions created in the bottom-up “phase”, above, to whatever extent seems helpful a. b.
Expert Answer
Answer to ENGR 102 Lab #12 Activity #1: Plotting Curves and Derivatives-to be done as a team As a team, you are to develop a progr… . . .
OR
