
[Solved]Chartcomponentjavaimport Javaawt Import Javautil Import Javaxswing Public Class Chartcompo Q37158854
ChartComponent.javaimport java.awt.*;import java.util.*;import javax.swing.*;public class ChartComponent extends JComponent { //the data (instance variables/properties) of this drawing private ArrayList<Double> values; private double maxValue; public ChartComponent(double max){ values = new ArrayList<Double>();//empty arraylist maxValue = max;//assign maxValue to the value provided by the user who is drawing the chart } public void appendValues(double value){ values.add(value);//add a new value to the arraylist repaint();//call paintcomponent to redraw } @Override public void paintComponent(Graphics g) { final int GAP = 10; final int BAR_HEIGHT = 10; int y = GAP + 10;//starting y = 20 g.drawString(“Feb 2019: Daily High Temperature”,100 ,10); g.setColor(Color.BLACK); for (int i=0; i< values.size(); i++){ //getting the temperature value from the arraylist double v = values.get(i); //scaling the bars to fit the chart component width int barWidth = (int) ((getWidth()-50) * v/maxValue);//why subtract 50? //drawing the bars, top left corner (x,y) is (0,y), length = barWidth, height =10 g.fillRect(0, y, barWidth, BAR_HEIGHT); //convert a number to a string by concatenating with an empty string //(0,y) is the bottom left corner (baseline point to start drawing a string) g.drawString(i+1+””, 0, y); //move the drawing y position down by including the height of the bar and the //gap between the bars. y = y + BAR_HEIGHT + GAP; } }}
ChartViewer.java
import java.awt.Dimension;import java.awt.event.ActionEvent;import java.awt.event.ActionListener;import java.io.File;import java.io.IOException;import java.util.Scanner;import javax.swing.*;public class ChartViewer extends JFrame{ public static void main(String[] args) { JFrame frame = new JFrame(); frame.setSize(500, 700); frame.setTitle(“Drawing”); frame.setDefaultCloseOperation(JFrame.EXIT_ON_CLOSE); final JButton button = new JButton(“Show Chart!”); final ChartComponent chart = new ChartComponent(66); chart.setPreferredSize(new Dimension(400, 600)); JPanel panel = new JPanel(); panel.add(button); panel.add(chart); frame.add(panel); frame.setVisible(true); class ButtonListener implements ActionListener { public void actionPerformed(ActionEvent event) { try{ File input = new File(“feb19_cincinnati_weather.txt”); Scanner in = new Scanner(input); try{ in.nextLine(); while(in.hasNextLine()){ String line = in.nextLine(); String [] lineContent = line.split(“t”); chart.appendValues(Integer.parseInt(lineContent[1])); }} finally{ in.close(); } } catch(IOException e){ System.out.println(“error file”); } }} ActionListener listener1 = new ButtonListener(); button.addActionListener(listener1); }}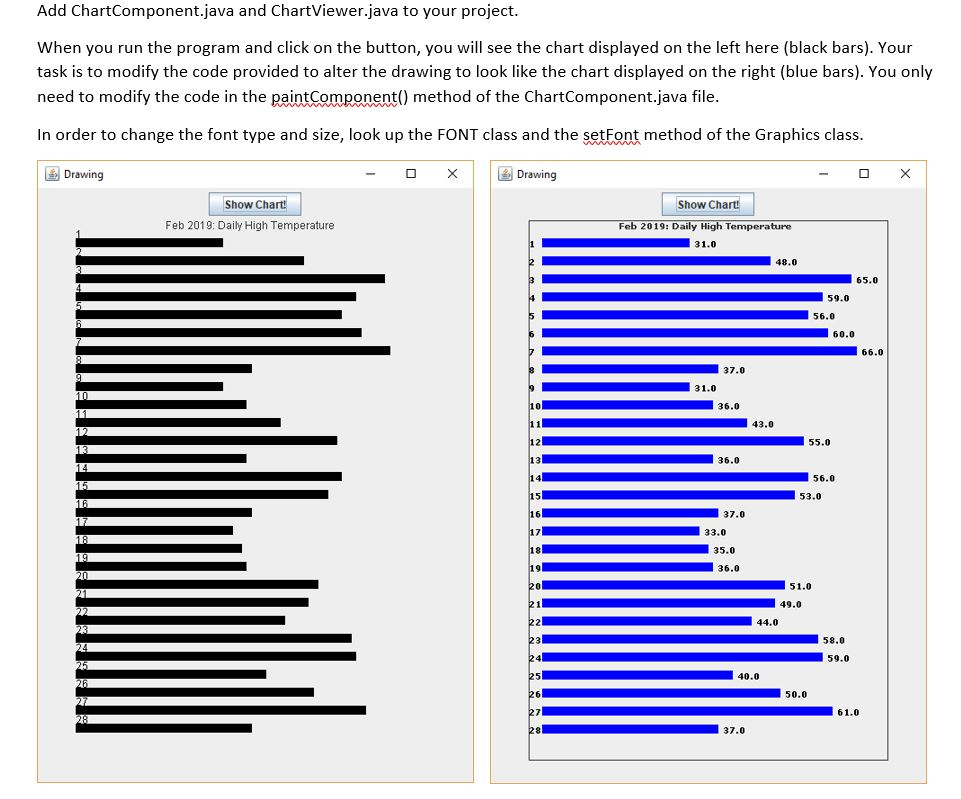 Add ChartComponent.java and ChartViewer.java to your project When you run the program and click on the button, you will see the chart displayed on the left here (black bars). Your task is to modify the code provided to alter the drawing to look like the chart displayed on the right (blue bars). You only need to modify the code in the paintComponent) method of the ChartComponent.java file In order to change the font type and size, look up the FONT class and the setFont method of the Graphics class | Drawing Drawing Show Cha Show Cha Feb 2019: Daily High Temperature Feb 2019: Dai Temperature 31.0 48.0 65.0 59.0 56.0 60.0 66.0 37.0 31.0 36.0 43.0 55.0 36.0 56.0 53.0 37.0 33.0 35.0 36.0 51.0 49.0 44.0 58.0 59.0 40.0 50.0 61.0 37.0 Show transcribed image text Add ChartComponent.java and ChartViewer.java to your project When you run the program and click on the button, you will see the chart displayed on the left here (black bars). Your task is to modify the code provided to alter the drawing to look like the chart displayed on the right (blue bars). You only need to modify the code in the paintComponent) method of the ChartComponent.java file In order to change the font type and size, look up the FONT class and the setFont method of the Graphics class | Drawing Drawing Show Cha Show Cha Feb 2019: Daily High Temperature Feb 2019: Dai Temperature 31.0 48.0 65.0 59.0 56.0 60.0 66.0 37.0 31.0 36.0 43.0 55.0 36.0 56.0 53.0 37.0 33.0 35.0 36.0 51.0 49.0 44.0 58.0 59.0 40.0 50.0 61.0 37.0
Expert Answer
Answer to ChartComponent.java import java.awt.*; import java.util.*; import javax.swing.*; public class ChartComponent extends JCo… . . .
OR