
[Solved] Objective Goal Lab Introduce Data Analysis Python Provided Dataset Canvas Folder Lab 09 Do Q37279836
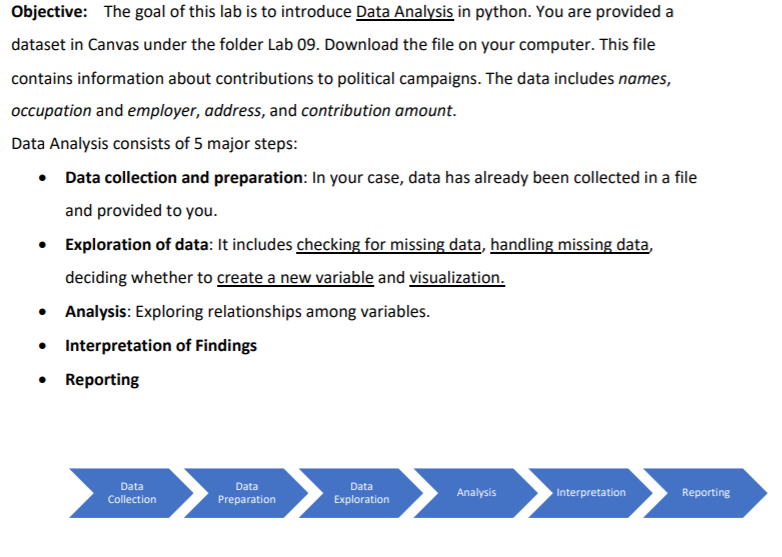
Objective: The goal of this lab is to introduce Data Analysis in python. You are provided a dataset in Canvas under the folder Lab 09. Download the file on your computer. This file contains information about contributions to political campaigns. The data includes names, occupation and employer, address, and contribution amount. Data Analysis consists of 5 major steps: Data collection and preparation: In your case, data has already been collected in a file and provided to you Exploration of data: It includes checking for missing data, handling missing data, deciding whether to Analysis: Exploring relationships among variables Interpretation of Findings Reporting create a new variable and visualization. Data Data Data Preparation Reporting Analysis Interpretation ation The goal of this data analysis exercise is to look at donation statistics by occupation and employer. This exercise will be completed in two lab exercises (Lab 09 and Lab 10). In Lab 09, you will learn how to load the data from a csv file and explore some features of the data The focus in this exercise is on data preparation and data exploration. You will use the following Python concepts in this data analysis exercise: Modules: pandas Files: reading from a file, writing to a file . Data types .Slicing Lists Dictionaries Functions: len) You will do the following: Use python library (module), pandas to load data from csv file to a pandas dataframe. (A DataFrame is a 2-dimensional labeled data structure with columns of potentially different types. Le, data is aligned in a tabular fashion in rows and columns.) 1. 2. Use pandas info) to print a concise summary of the dataframe. This method prints information about a dataFrame including the names of columns, data type, number of columns and memory used. 3. To look at an individual sample record(or row), use pandas iloc) with any valid index number. iloc stands for inteaer-location based indexing (or selection by position). 4. Get a list of all unique political candidates using pandas unique. S. Calculate the number of unique political candidates. 6. Does the data include any information about the party affiliation? If you see the information printed by pandas infol), you will notice that no such information is present in the data. So, add it using a dictionary. It is more time consuming to add it for all the candidates so we will just add it for 4 of them. 7. Once we have a dictionary, can we map it to the data using pandas map). 8. Add parties as a column and use pandas value_counts) to get a count of democrats and republicans. 9. This data includes both contributions and refunds. Count the number of each. 10. Restrict the dataset to positive contributions (i.e. contributions >0). 11. Prepare a subset of two main candidates: Barack Obama and Mitt Romney. You can use pandas isin). 12. Write that subset to a file called “output.csv. This file will contain information about only two candidates: Barack Obama and Mitt Romney. You will also notice the column, party has been added to the data. You have to submit this file to Canvas. Show transcribed image text Objective: The goal of this lab is to introduce Data Analysis in python. You are provided a dataset in Canvas under the folder Lab 09. Download the file on your computer. This file contains information about contributions to political campaigns. The data includes names, occupation and employer, address, and contribution amount. Data Analysis consists of 5 major steps: Data collection and preparation: In your case, data has already been collected in a file and provided to you Exploration of data: It includes checking for missing data, handling missing data, deciding whether to Analysis: Exploring relationships among variables Interpretation of Findings Reporting create a new variable and visualization. Data Data Data Preparation Reporting Analysis Interpretation ation
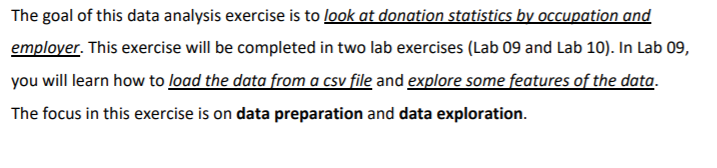
The goal of this data analysis exercise is to look at donation statistics by occupation and employer. This exercise will be completed in two lab exercises (Lab 09 and Lab 10). In Lab 09, you will learn how to load the data from a csv file and explore some features of the data The focus in this exercise is on data preparation and data exploration.
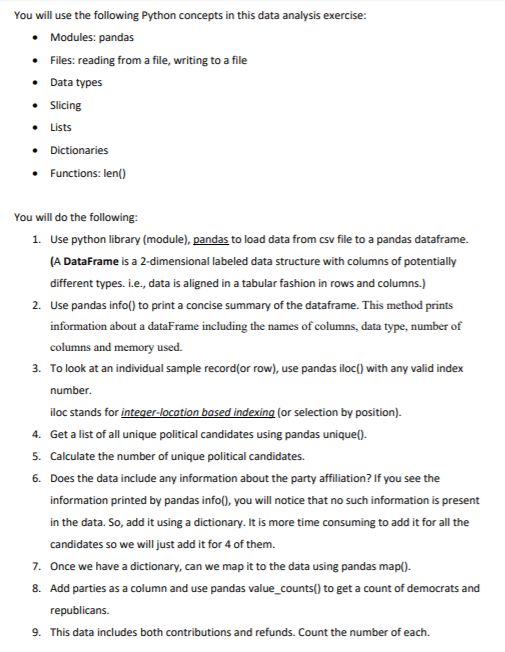
You will use the following Python concepts in this data analysis exercise: Modules: pandas Files: reading from a file, writing to a file . Data types .Slicing Lists Dictionaries Functions: len) You will do the following: Use python library (module), pandas to load data from csv file to a pandas dataframe. (A DataFrame is a 2-dimensional labeled data structure with columns of potentially different types. Le, data is aligned in a tabular fashion in rows and columns.) 1. 2. Use pandas info) to print a concise summary of the dataframe. This method prints information about a dataFrame including the names of columns, data type, number of columns and memory used. 3. To look at an individual sample record(or row), use pandas iloc) with any valid index number. iloc stands for inteaer-location based indexing (or selection by position). 4. Get a list of all unique political candidates using pandas unique. S. Calculate the number of unique political candidates. 6. Does the data include any information about the party affiliation? If you see the information printed by pandas infol), you will notice that no such information is present in the data. So, add it using a dictionary. It is more time consuming to add it for all the candidates so we will just add it for 4 of them. 7. Once we have a dictionary, can we map it to the data using pandas map). 8. Add parties as a column and use pandas value_counts) to get a count of democrats and republicans. 9. This data includes both contributions and refunds. Count the number of each.
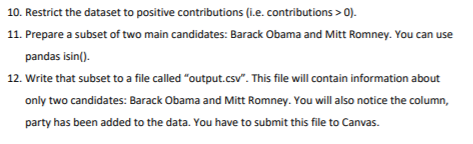
10. Restrict the dataset to positive contributions (i.e. contributions >0). 11. Prepare a subset of two main candidates: Barack Obama and Mitt Romney. You can use pandas isin). 12. Write that subset to a file called “output.csv. This file will contain information about only two candidates: Barack Obama and Mitt Romney. You will also notice the column, party has been added to the data. You have to submit this file to Canvas.
Expert Answer
Answer to Objective: The goal of this lab is to introduce Data Analysis in python. You are provided a dataset in Canvas under the … . . .
OR
