
[solved]-Assignment Background Assignment Simple Statistical Analysis Nba National Basketball Assoc Q39041334
Assignment Background: This assignment will do some simple statistical analysis of some NBA (National Basketball Association) data from 2016/17 and 2017/18 season (2017.csv and 2018.csv respectively). This data has been downloaded from: www.nbastuffer.com We have also given you a small file for testing purposes (4lines.csv) Each file has the same columns where the first row indicates what data is in each column. For this assignment you will not be interested in all of the data but you will write functions to help you extract the data that you want to analyze. We have provided you with expected output files for the 3 input files provided (2017out.csv, 2018out.csv and 4linesout.csv) Your output should match these. You can assume that if the filename refers to a file that exists, that file will be in expected format. We will test your solutions with other input files but they will always be in the expected format. Download the three .csv (comma separated value) files provided and assignment8.py to your working directory. In the assignment8.py file you will see that we have specified a set of constants to help with data extraction given the columns of the csv file and format of the tuples you will be creating. In the assignment8.py file you will also see we have provided you with the documentation and tests for the following functions: • read_file get_val filter_list contains get_unique get_max get_avg • get_report Complete this assignment by doing the following for each function: uncomment one test function call in main implement the corresponding function following the given documentation run tests to ensure your implementation is correct repeat until all functions are tested and implemented NOTE: The get_report and write_stats functions will require you to inspect the output files to ensure your functions have the correct behavior. Just running the test_get_report function is not sufficient. NOTICE: the highest scoring forward is printed – to determine this player you should consider players with POS of SF (shooting forward) and F (forward) but not PF (power forward) Below is the sample output of 4linesout.csv that your output should match: Team, Average Points/Game, Average Rebounds/Game, Average Steals/Game, Average Blocks/Game Den, 7.9,4.4,0.3,0.4 Tor, 8.4,6.0,1.1,1.1 highest scoring forward is: , Torrey Craig points per game:,6.6 rebounds per game:,5.1 steals per game:,0.5 blocks per game: ,0.36 4line v 76% vu . TODE View Zoom Add Category Insert Table Chart Text Shape Media Comment Collaba + Sheet 1 RANK FULL NAME TEAM POS AGE GP MPG MINX Minutes PercentagePercentage of team minutes used by a player while he was on the floor USG%Usage RateUsage rate, a.k.a., usage percentage is an estimate of the percentage of team plays used by a play Wil Barton Den G 28.38 14 23.4 48.8 Malk Beasley Deri G 22.47 14 20.1 41.8 Marc Gasol Tor C 34.3 13 31.7 Tomay Craig Den F 28.41 14 23.6 49.2 4line D View + 76% Zoom vo. TOND Add Category Insert Table Chart Text Shape Media Comment Collabo Sheet1 FG% Effective Shooting Percentage With FG%, three-point shots made are plays used by a player while he was on the floor Tor%Turnover RateA metric that estimates the number of turnovers a player commits per 100 possessions FTA FT% 21.6 8.2 26 0.592 6.2 31 0.71 7.4 14 0.788 7.3 18 0.563 2PA 2P% 80 0.4 46 0.37 48 0.478 23 0.486 3PA 3P% 55 0.273 47 0404 48 0.275 36 0.472 76% D View # Insert All Chart 4line T. Text Zoom Add Category Table Shape Media Comment Collabo Sheet1 e worth 50% more than two-point shots made. FG% Formula=(FGM+ (0.5 x 3PMIFGA TS%True Shooting Percentage True shooting percentage is a measure of shooting efficiency that takes into account field goals, 3-point field goals, and free throws. PPG PointsPoints 0.404 0.434 0.489 0.53 0.521 0.544 0.605 0.601 We were unable to transcribe this imagev View + 76% Zoom Sheet1 – Chart 4line T Text Add Category Insert Table Shape Media Comment Collabo at PercentageAssist percentage is an estimated percentage of teammate field goals a player assisted while the player is on the court SPGSteals Steals per game. BPGBlocks Blocks per game. TOPG TumoversTurnovers per game. VIVersatility Index Versatility Index is a me 0.28 0.64 0.93 7.3 0.21 0.07 1.15 1.08 0.62 0.26 0.43 o View 76% Zoom Sheet1 E Insert B Table 4line т Text Add Category Chart Shape Media Comment Collabc ex is a matric that measures a player’s ability to produce in paints, assists, and rebounds. The average player will score around a five on the index, while top players score above 1 ORTGOffensive Ratingindividual atfensive rating is the number of points produced by a player We were unable to transcribe this imageo View 125% Zoom Æ Insert el Chart – TO 4lineout T. Text Add Category Table Shape Media Comment Collaba + Sheet 1 Adjust Settings Team ? Table data was imported. 4lineout Average Points/Game Average Rebounds/Game Average Steals/Game Average Blocks/Game 0.4 1.1 1.1 Den 4.4 0.3 7.9 8.4 Tor highest scoring forward is: Torrey Craig points per game: rebounds per game: 6.6 5.1 0.5 steals per game: blocks per game: 0.36 o View 125% Zoom 2017out El T Insert Table Chart Text Add Category Shape Media Comment Collaborat + Sheet1 ? Table data was imported. Adjust Settings 2017out Team Average Points/Game Average Rebounds/Game Average Steals/Game Average Blocks/Game Min 0.7 Uta Chi Ind Nor Lal Gol Dal Nyk Okc Mil Por Sac Tor Cle Was Hou San Orl 0.6 Bro Ati Phi Mem 3.2 0.5 0.8 0.7 Lac 3.8 2017out o View + 125% Zoom Sheet 1 Add Category Insert Table Chart Text Shape Media Comment Collabo Lac 0.6 Bos Cha Det Pho 0.7 Den 3.4 3.4 0.4 0.4 0.4 Mia highest scoring forward is: LeBron James points per game: rebounds per game: 27.5 8.7 1.41 0.87 steals per game: blocks per game: 125% Ev Insert 2018out T I Text Shape Zoom Add Category Table Chart Media Comment Collabor View + Sheet 1 2018out ? Table data was imported. Adjust Settings Team Den Average Points/Game Average Rebounds/Game Average Steals/Game Average Blocks/Game 0.5 0.4 0.5 9.1 0 Por Tor 0 Hou 0.7 Gol Phi Mil Bro Okc Uta Det Lac Ind Bos highest scoring forward is: Kevin Durant points per game: 34.2 5.2 rebounds per game: steals per game: 1.18 blocks per game: Show transcribed image text Assignment Background: This assignment will do some simple statistical analysis of some NBA (National Basketball Association) data from 2016/17 and 2017/18 season (2017.csv and 2018.csv respectively). This data has been downloaded from: www.nbastuffer.com We have also given you a small file for testing purposes (4lines.csv) Each file has the same columns where the first row indicates what data is in each column. For this assignment you will not be interested in all of the data but you will write functions to help you extract the data that you want to analyze. We have provided you with expected output files for the 3 input files provided (2017out.csv, 2018out.csv and 4linesout.csv) Your output should match these. You can assume that if the filename refers to a file that exists, that file will be in expected format. We will test your solutions with other input files but they will always be in the expected format.
Download the three .csv (comma separated value) files provided and assignment8.py to your working directory. In the assignment8.py file you will see that we have specified a set of constants to help with data extraction given the columns of the csv file and format of the tuples you will be creating. In the assignment8.py file you will also see we have provided you with the documentation and tests for the following functions: • read_file get_val filter_list contains get_unique get_max get_avg • get_report Complete this assignment by doing the following for each function: uncomment one test function call in main implement the corresponding function following the given documentation run tests to ensure your implementation is correct repeat until all functions are tested and implemented
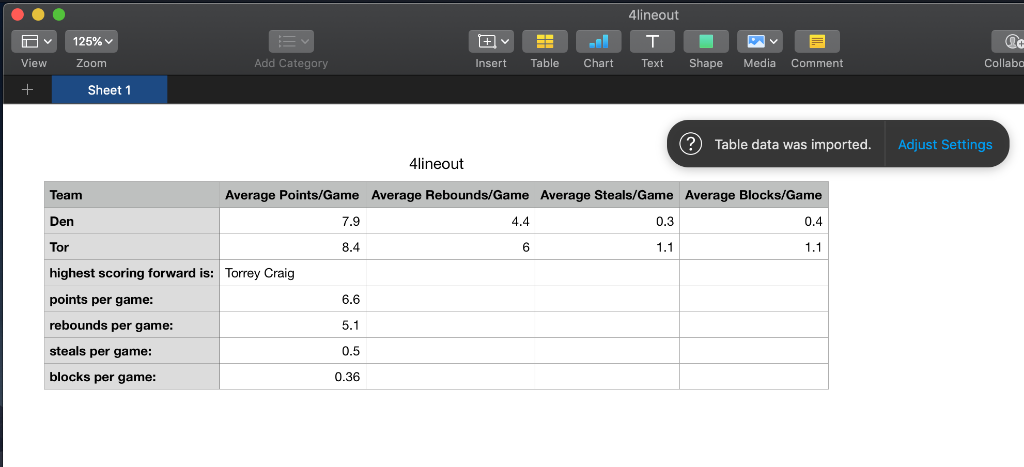
NOTE: The get_report and write_stats functions will require you to inspect the output files to ensure your functions have the correct behavior. Just running the test_get_report function is not sufficient. NOTICE: the highest scoring forward is printed – to determine this player you should consider players with POS of SF (shooting forward) and F (forward) but not PF (power forward) Below is the sample output of 4linesout.csv that your output should match: Team, Average Points/Game, Average Rebounds/Game, Average Steals/Game, Average Blocks/Game Den, 7.9,4.4,0.3,0.4 Tor, 8.4,6.0,1.1,1.1 highest scoring forward is: , Torrey Craig points per game:,6.6 rebounds per game:,5.1 steals per game:,0.5 blocks per game: ,0.36
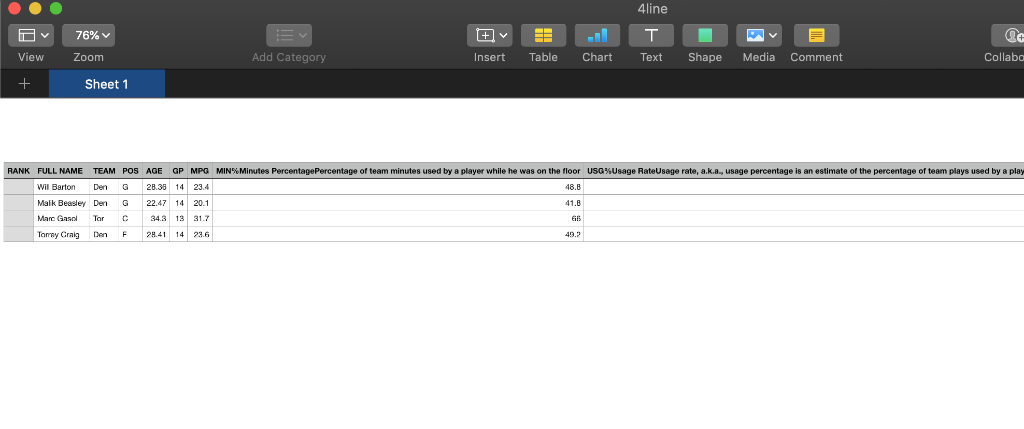
4line v 76% vu . TODE View Zoom Add Category Insert Table Chart Text Shape Media Comment Collaba + Sheet 1 RANK FULL NAME TEAM POS AGE GP MPG MINX Minutes PercentagePercentage of team minutes used by a player while he was on the floor USG%Usage RateUsage rate, a.k.a., usage percentage is an estimate of the percentage of team plays used by a play Wil Barton Den G 28.38 14 23.4 48.8 Malk Beasley Deri G 22.47 14 20.1 41.8 Marc Gasol Tor C 34.3 13 31.7 Tomay Craig Den F 28.41 14 23.6 49.2
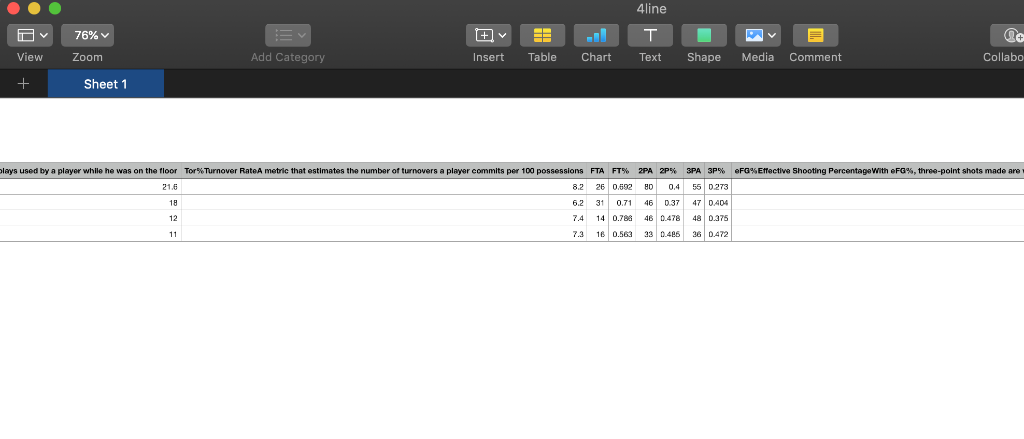
4line D View + 76% Zoom vo. TOND Add Category Insert Table Chart Text Shape Media Comment Collabo Sheet1 FG% Effective Shooting Percentage With FG%, three-point shots made are plays used by a player while he was on the floor Tor%Turnover RateA metric that estimates the number of turnovers a player commits per 100 possessions FTA FT% 21.6 8.2 26 0.592 6.2 31 0.71 7.4 14 0.788 7.3 18 0.563 2PA 2P% 80 0.4 46 0.37 48 0.478 23 0.486 3PA 3P% 55 0.273 47 0404 48 0.275 36 0.472
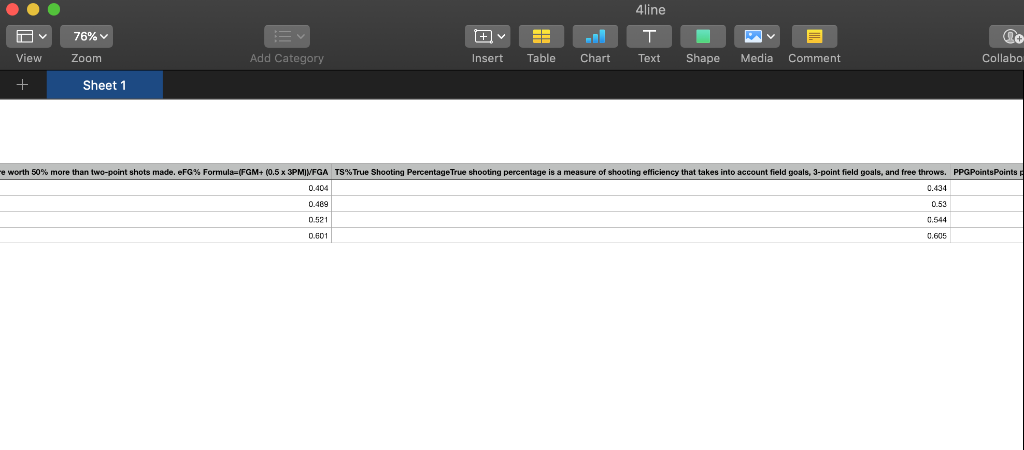
76% D View # Insert All Chart 4line T. Text Zoom Add Category Table Shape Media Comment Collabo Sheet1 e worth 50% more than two-point shots made. FG% Formula=(FGM+ (0.5 x 3PMIFGA TS%True Shooting Percentage True shooting percentage is a measure of shooting efficiency that takes into account field goals, 3-point field goals, and free throws. PPG PointsPoints 0.404 0.434 0.489 0.53 0.521 0.544 0.605 0.601
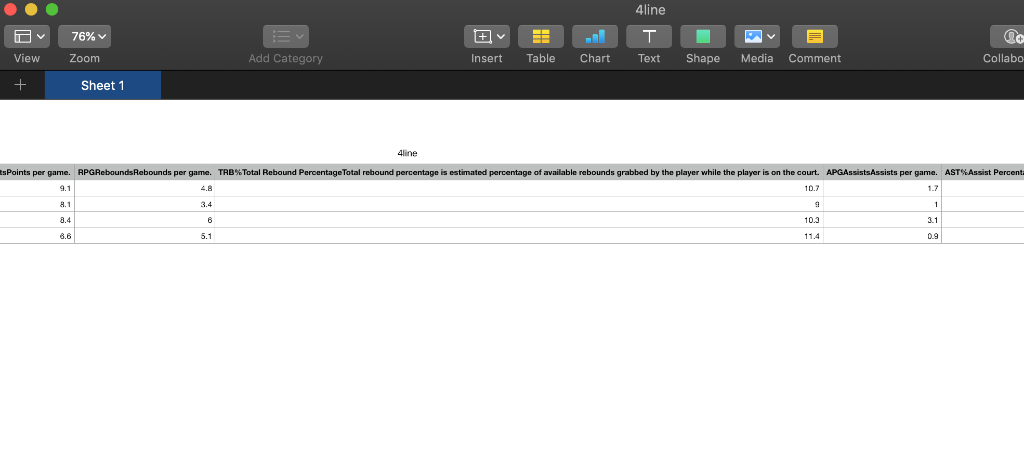
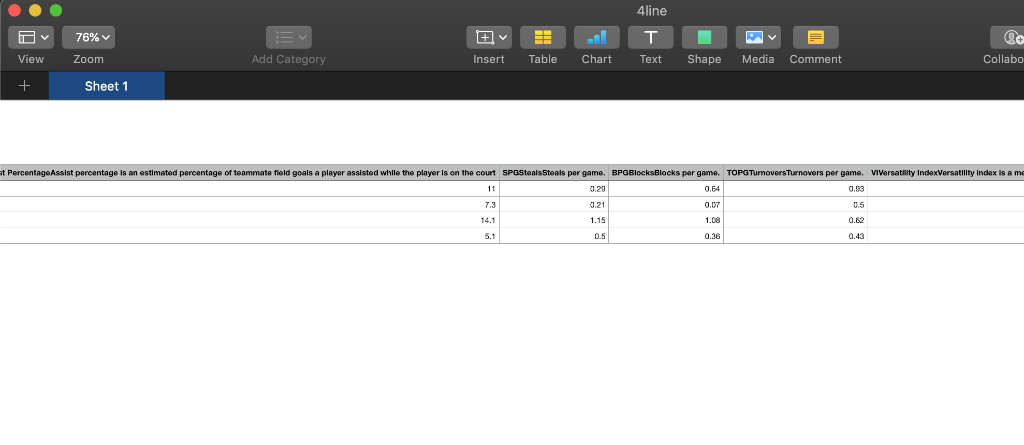
v View + 76% Zoom Sheet1 – Chart 4line T Text Add Category Insert Table Shape Media Comment Collabo at PercentageAssist percentage is an estimated percentage of teammate field goals a player assisted while the player is on the court SPGSteals Steals per game. BPGBlocks Blocks per game. TOPG TumoversTurnovers per game. VIVersatility Index Versatility Index is a me 0.28 0.64 0.93 7.3 0.21 0.07 1.15 1.08 0.62 0.26 0.43
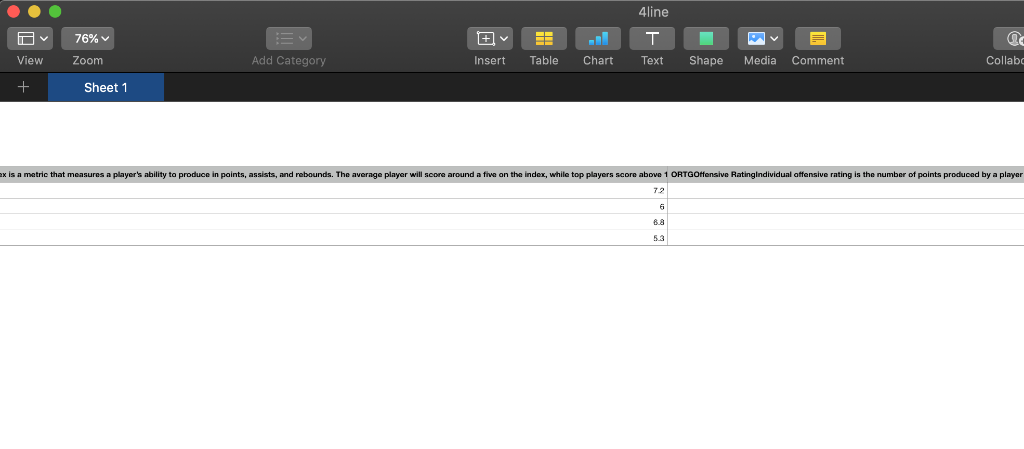
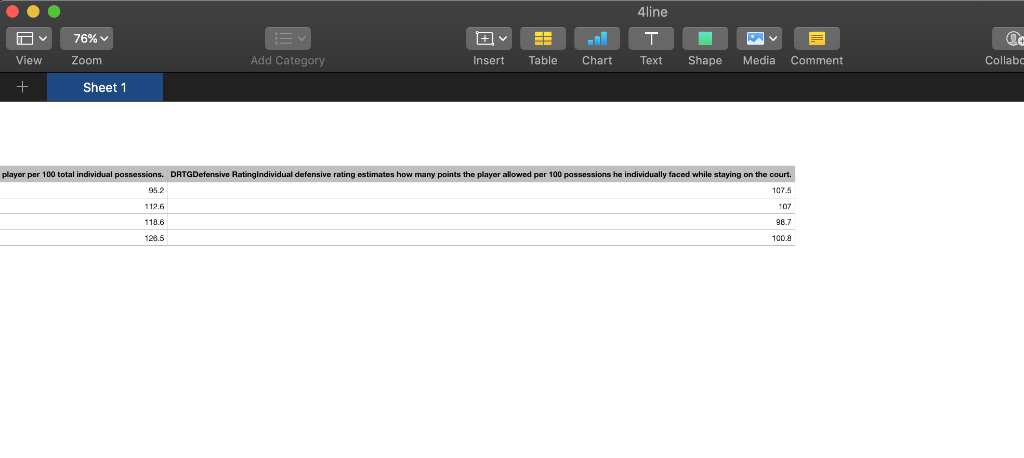
o View 76% Zoom Sheet1 E Insert B Table 4line т Text Add Category Chart Shape Media Comment Collabc ex is a matric that measures a player’s ability to produce in paints, assists, and rebounds. The average player will score around a five on the index, while top players score above 1 ORTGOffensive Ratingindividual atfensive rating is the number of points produced by a player
o View 125% Zoom Æ Insert el Chart – TO 4lineout T. Text Add Category Table Shape Media Comment Collaba + Sheet 1 Adjust Settings Team ? Table data was imported. 4lineout Average Points/Game Average Rebounds/Game Average Steals/Game Average Blocks/Game 0.4 1.1 1.1 Den 4.4 0.3 7.9 8.4 Tor highest scoring forward is: Torrey Craig points per game: rebounds per game: 6.6 5.1 0.5 steals per game: blocks per game: 0.36
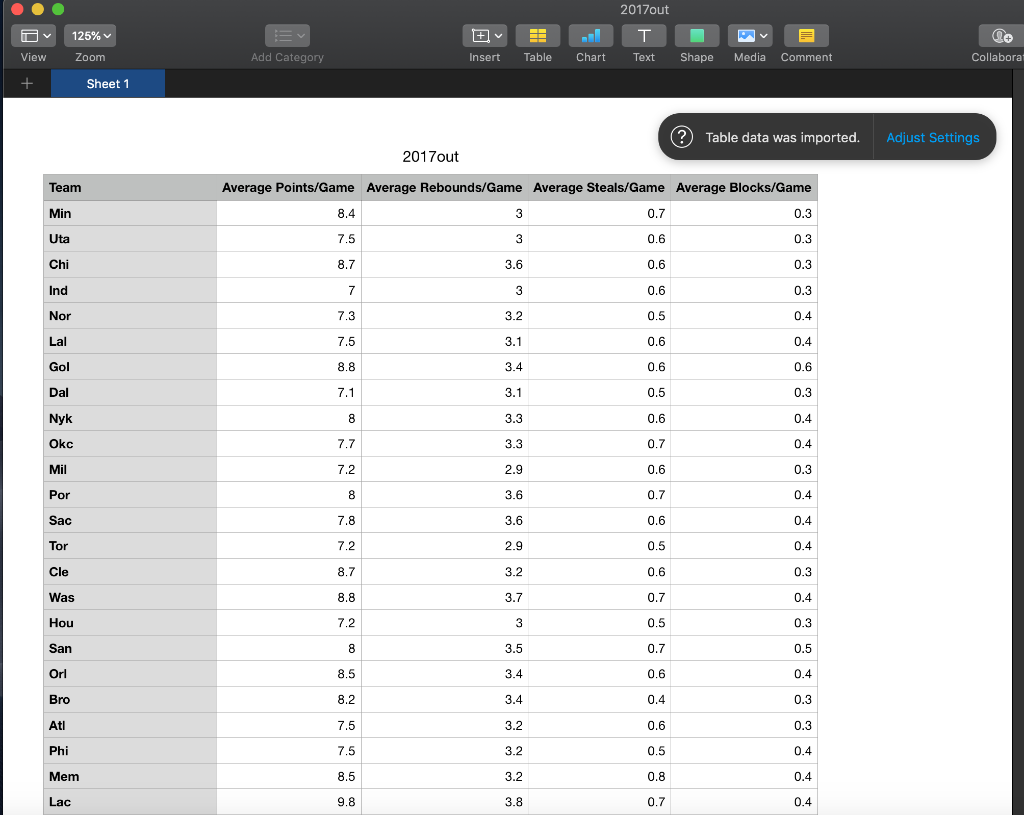
o View 125% Zoom 2017out El T Insert Table Chart Text Add Category Shape Media Comment Collaborat + Sheet1 ? Table data was imported. Adjust Settings 2017out Team Average Points/Game Average Rebounds/Game Average Steals/Game Average Blocks/Game Min 0.7 Uta Chi Ind Nor Lal Gol Dal Nyk Okc Mil Por Sac Tor Cle Was Hou San Orl 0.6 Bro Ati Phi Mem 3.2 0.5 0.8 0.7 Lac 3.8
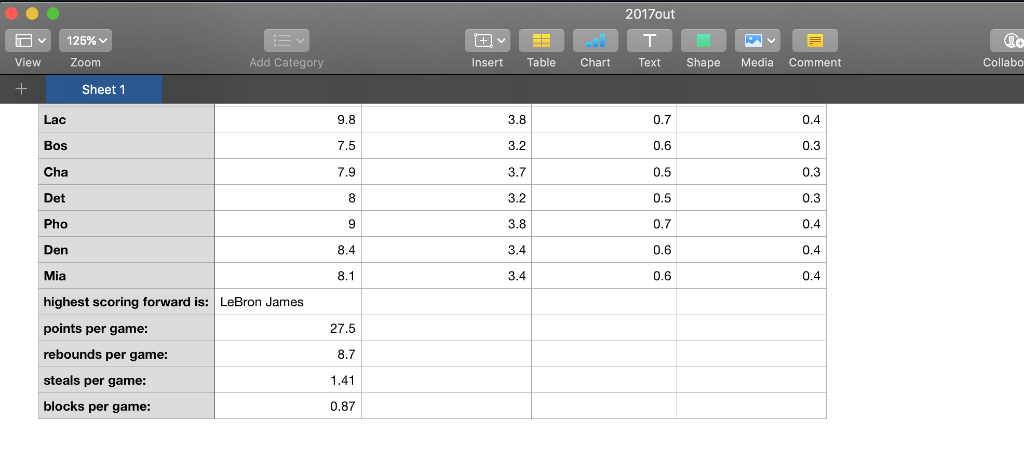
2017out o View + 125% Zoom Sheet 1 Add Category Insert Table Chart Text Shape Media Comment Collabo Lac 0.6 Bos Cha Det Pho 0.7 Den 3.4 3.4 0.4 0.4 0.4 Mia highest scoring forward is: LeBron James points per game: rebounds per game: 27.5 8.7 1.41 0.87 steals per game: blocks per game:
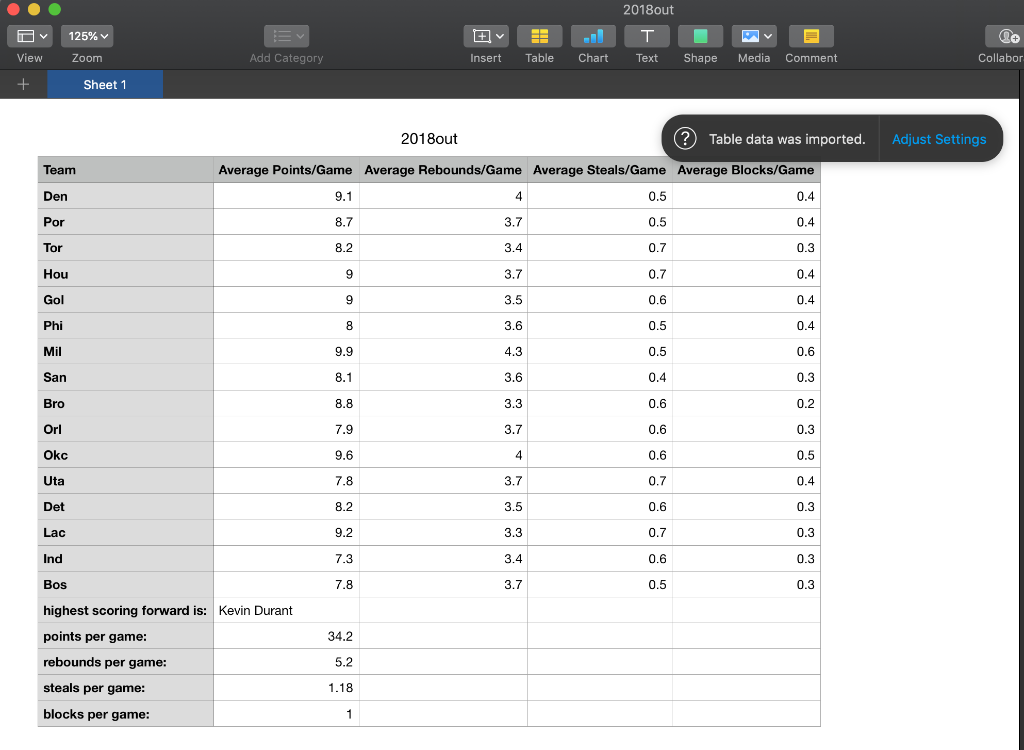
125% Ev Insert 2018out T I Text Shape Zoom Add Category Table Chart Media Comment Collabor View + Sheet 1 2018out ? Table data was imported. Adjust Settings Team Den Average Points/Game Average Rebounds/Game Average Steals/Game Average Blocks/Game 0.5 0.4 0.5 9.1 0 Por Tor 0 Hou 0.7 Gol Phi Mil Bro Okc Uta Det Lac Ind Bos highest scoring forward is: Kevin Durant points per game: 34.2 5.2 rebounds per game: steals per game: 1.18 blocks per game:
Expert Answer
Answer to Assignment Background: This assignment will do some simple statistical analysis of some NBA (National Basketball Associa… . . .
OR
